

Per-mile pay
$/mileCompare posted driver rates per mile, with sample counts beside the median.
Market statistics
Compare what drivers ask for with what companies advertise, using the posts collected in DriverNova.
Pay benchmarks
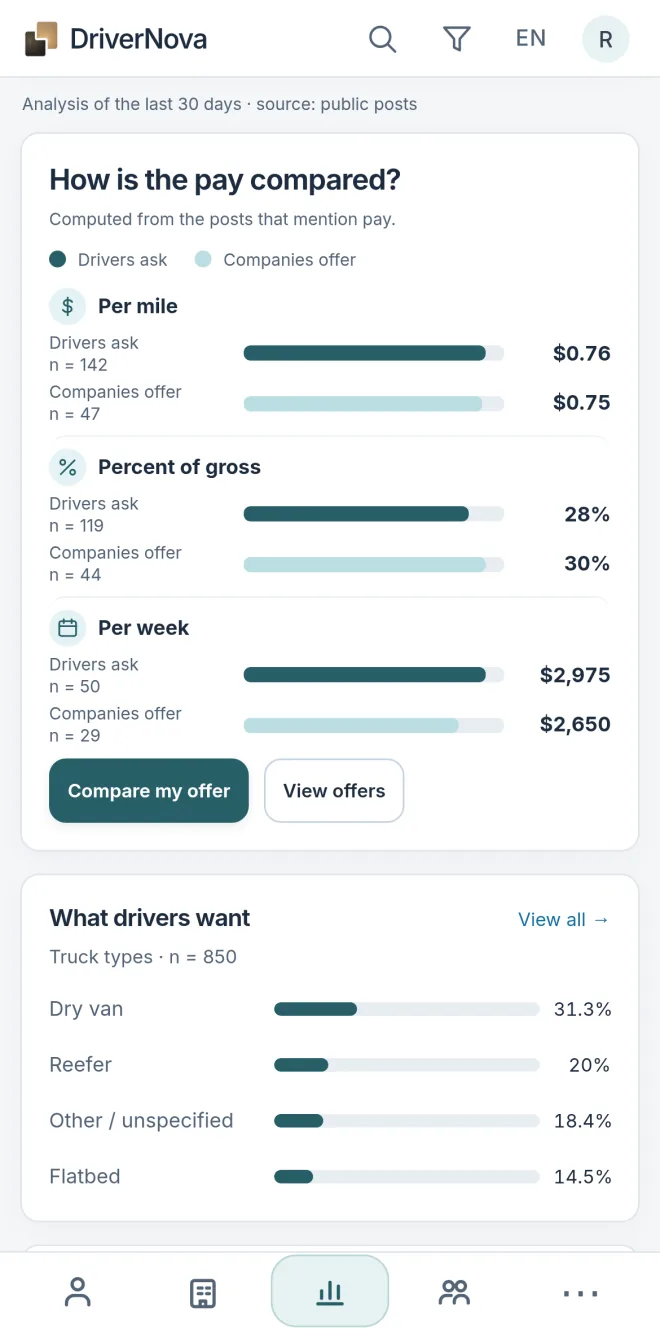
The dashboard compares what drivers request with what companies advertise, where there is enough data. Review 7 or 30 days, with equipment and state breakdowns.
 Enlarge the screenshot
Requires an account. Opens the application.
Compare posted driver rates per mile, with sample counts beside the median.
Review weekly amounts extracted from the wording of company and driver posts.
Company-driver percentage benchmarks exclude owner-operator percentages.
Benchmarks use the collected posts for the selected period. They describe advertised terms, not verified earnings or a nationwide salary average. Benchmark summaries require at least five observations.
Company hiring ads
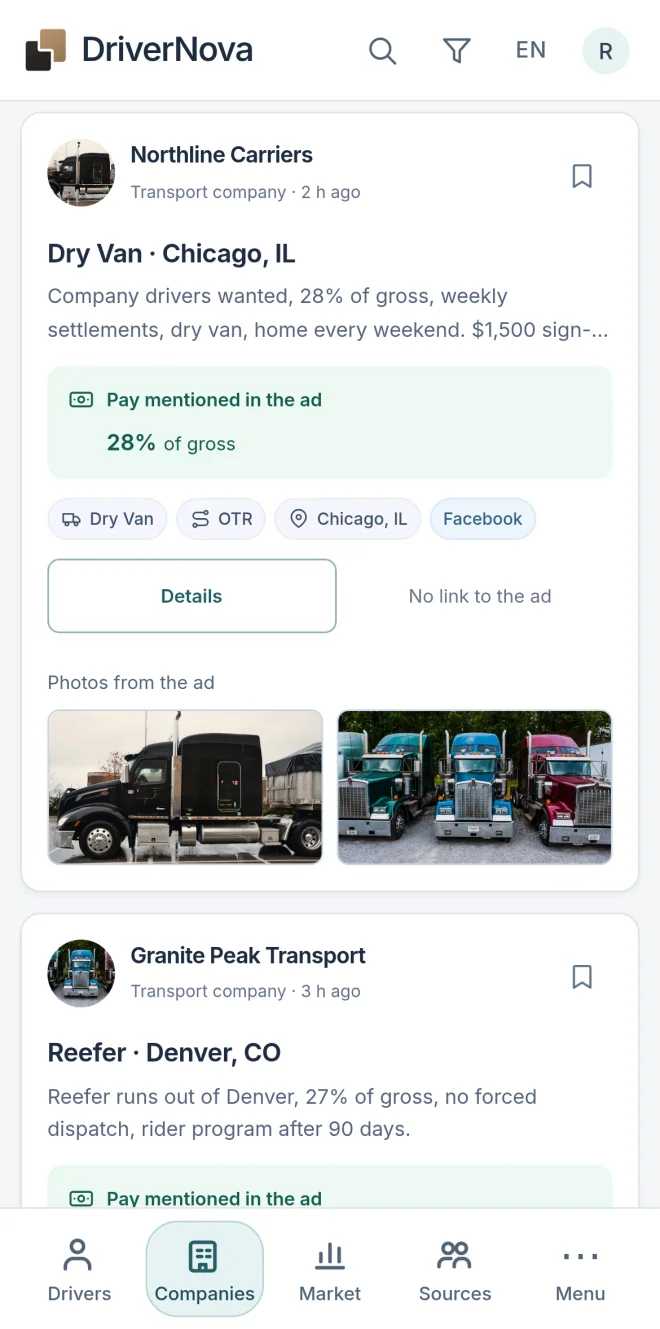
Keep the original ad and its available details together. Save relevant offers and open captured replies to review the related driver profiles.
 Enlarge the screenshot
Company or recruiter, pay terms, equipment, routes, hiring location and posting recency. Bonus and home-time terms stay tied to the source post.
Review distinct ads, repeated postings and active days. Use that activity to decide which companies and roles deserve a closer look.
Open the source post, read the captured wording, translate the ad into English, Russian or Romanian and keep useful ads in your saved list.
Where supply and hiring activity meet
Review the equipment and job types drivers mention, experience bands and posting locations. Use the available details to focus your sourcing.
See companies by distinct hiring ads and how often offers reappear. Compare observed driver posts with hiring ads by state and week.
Explore ranked offers with explanations that consider pay, bonus, home time, equipment demand and recency.
Use editable templates in English, Romanian, Russian and Spanish. Review the role and terms you can represent before sending your message.
Read the numbers with their context
The market view covers 7 or 30 days. State and period selections shape the results. The source filter applies to driver data; company offers keep their own collected-source coverage.
Per-mile, weekly and percentage amounts stay separate. Company-driver percentage benchmarks exclude owner-operator percentages. Missing information is not treated as zero; small samples may have no median.
Repeated ads and driver posts show observed activity. Review the source and confirm the terms in conversation.
One workspace for the recruiting decision
Bring sourcing, company research and follow-up into the same brief.